 Earthquakes in Alabama?
- Northern and North-Central Alabama
Seismicity
"Though the Earth Be Moved"
- The 1964 Great Alaska Earthquake
Anatomy of a Mega-Quake
- The Great Tohoku Earthquake of 2011
World Trade Center Disaster
Seismic Signatures
Earthquake Weather -
Fact or Fiction?
The World's Largest Recorded
Earthquake
The Seismic Signature of Tornadoes

World Trade
Center Disaster Seismic Signatures
September 11, 2001,
New York City, USA
The
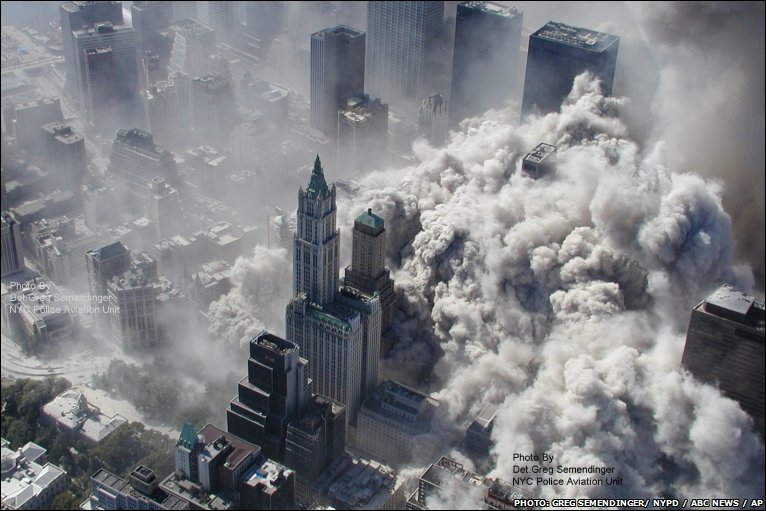
terrorist attacks against the United States and the World Trade Center
(WTC) in
New York City on the morning
of
September 11, 2001 not only created shock waves
in the political and social fabric of the United States, but also
formed a
tragic
backdrop to a most interesting seismic study of
artificially-generated
seismic signals and how these compare to the
seismic
signatures from earthquakes.
Ground vibrations associated with the
collapse of the World Trade Center buildings were
recorded
across five states, and as far
away as 428 km (265 miles) from New York City.
The terrorist attacks produced a complex
array
of signals generated both
from the initial impact of the airplanes, to the collapse of the WTC
Towers and
subsequent
collapses
of neighboring buildings.
As will be shown, the North Tower collapse produced a
seismic
signature equivalent
to a magnitude 2.3 earthquake.
Actually,
several
seismic stations in the greater New York City area recorded signatures
of
ground vibrations from the terrorist attacks
that morning in lower Manhattan
(see Figure 1). The
closest was the
Lamont-Doherty Cooperative Seismic Network (LCSN)
station PAL located at Palisades,
NY. Lamont-Doherty
operates 34 seismograph stations in seven Mid-Atlantic and New
England
states.
The network has been in operation since the early 1970s.
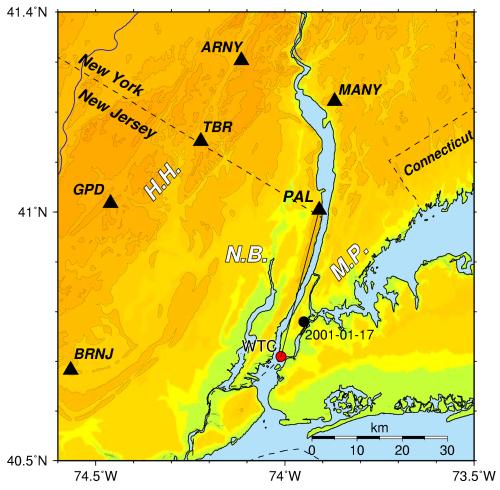
Figure 1
Seismic Stations Near
Greater New York City
(from:
http://911research.wtc7.net/mirrors/guardian2/wtc/seismic/WTC_LDEO_KIM.htm)
Numerous
seismic signals were recorded at station PAL, first a smaller signature
when
the airplanes impacted the WTC towers,
and then much larger indications as the
towers collapsed. The
timeline for the
two building impacts and subsequent three collapses
of the North and South
Towers and the smaller WTC Building 7 begins at approximately 12:46:26
UTC
(8:46:26 EDT) and shows
Richter Scale Magnitudes from 0.9
to 2.3 (see Figure 2).

Figure 2
WTC Impacts and
Collapse Times and Richter Scale Magnitudes
(from:
http://www.ldeo.columbia.edu/LCSN/Eq/20010911_wtc.html)
The
seismogram from station PAL shows that the WTC North Tower collapse was
the
largest seismic source and had a local
magnitude ML 2.3 (see Figure 3). The
seismogram begins at 12:40 UTC and each
trace in the seismogram is 30 minutes long.
The North Tower was subject to the first impact (8:46 EDT) and the
second collapse (10:28 EDT, magnitude 2.3), while the
South Tower saw the
second impact at 9:02 EDT and collapsed first at 9:59 EDT (magnitude
2.1).
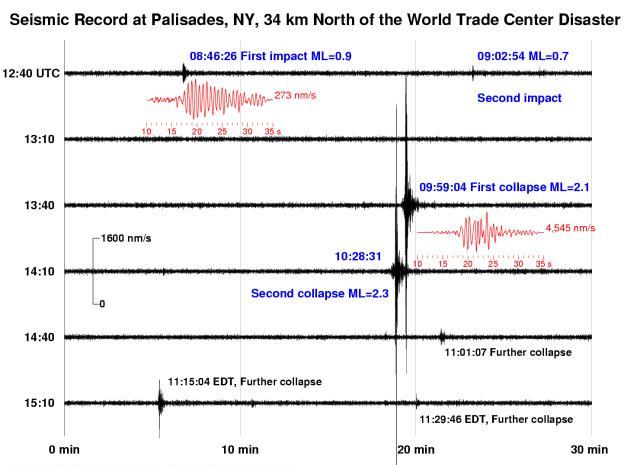
Figure 3
PAL Seismogram from
WTC Impacts and Collapses, 11 Sept 2013
(from:
http://911research.wtc7.net/mirrors/guardian2/wtc/seismic/WTC_LDEO_KIM.htm)
Overall,
six stations within the greater Metropolitan New York region (Fig. 4)
recorded
the two tower collapses. Unfortunately,
no
seismic recordings of ground motion are currently known to exist at
or very
close to the WTC complex. Figure
3 shows the North
Tower collapse signature at
stations PAL, BRNJ, TBR, MANY, and ARNY, indicating the
different times (in seconds) after
the
collapse at which the seismic signals were detected at the several
stations.
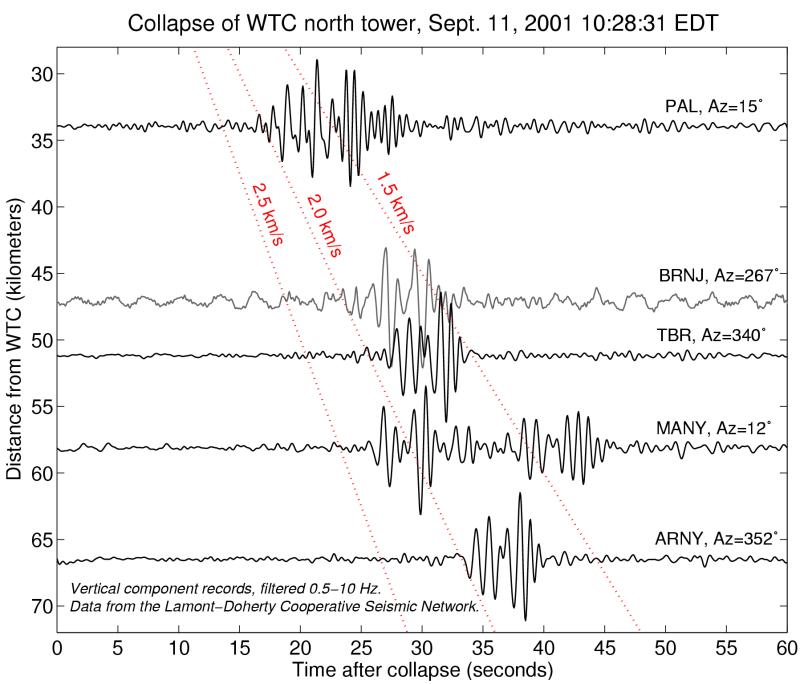
Figure
4
World Trade Center North Tower Collapse Seismograms at Five Local
Stations
(from:
http://911research.wtc7.net/mirrors/guardian2/wtc/seismic/WTC_LDEO_KIM.htm)
The
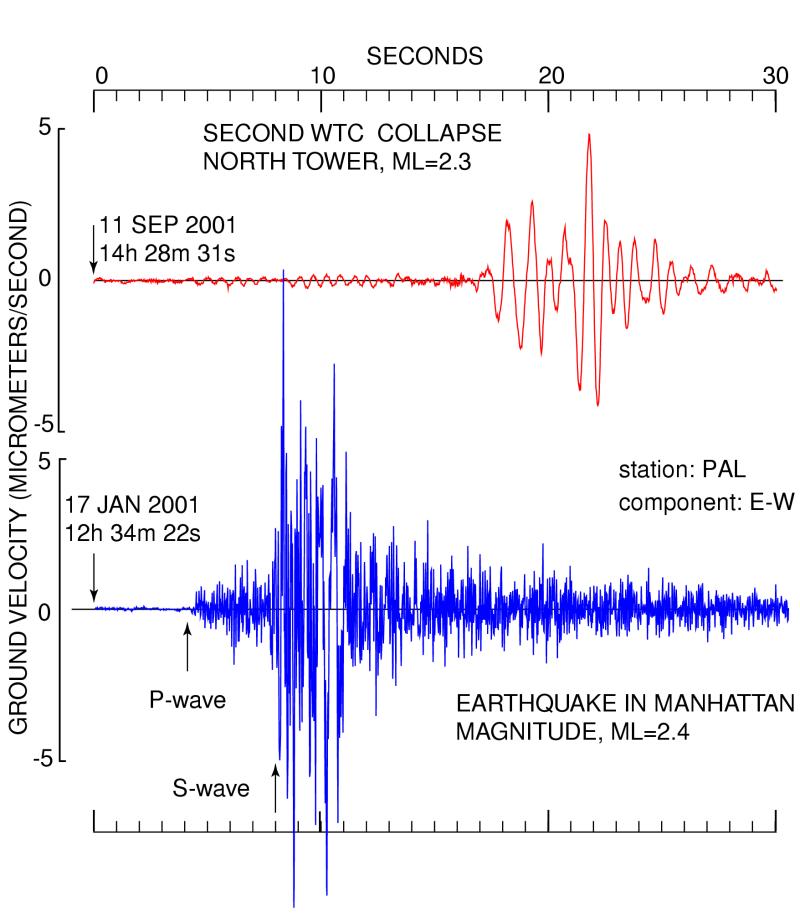
signals at PAL from the North Tower collapse and a small felt
earthquake
that had occurred beneath the east side of Manhattan
on January 17, 2001 were of comparable magnitude
(see Figure 5). However,
the character of the
two seismograms is quite
different.
Note that distinct P and S body wave responses are seen
only for the
earthquake; this is usually the case in comparing
the seismic signatures of
man-made ground disturbances and those recorded in earthquake events.
Figure
5
Magnitude Comparison of WTC North Tower Collapse and Small Earthquake
(from:
http://911research.wtc7.net/mirrors/guardian2/wtc/seismic/WTC_LDEO_KIM.htm)
Earthquakes
of magnitude
2.3 are not known to cause any structural damage in buildings.
In the
eastern
U.S. that threshold is
believed to be close to or above ML 4 to 4.5.
It
has been estimated that the total gravitational potential energy
associated
with the
collapse of each of the WTC towers was at least 10xE11 Joules. The
energy propagated as seismic waves for a magnitude 2.3
earthquake is
about 1.8xE8 Joules (see http://alabamaquake.com/energy.html), or less than about five
thousandths of the total
potential energy release involved in the collapse.
So, only a very small
portion of the total
gravitational potential energy in the building collapse was converted
into
seismic waves.
Instead,
most of the
energy went into the deformation of building structures as they fell,
and the
formation of rubble and dust.
Accordingly,
local observations of the WTC tower collapses did not indicated that
ground shaking was a major contributor to the
collapse or damage to
surrounding
buildings.
The
seismic energy of a ML
0.7 to 0.9 energy release computed for the building impacts is but a
tiny
fraction of the total kinetic
energy (about 2 x 10xE9 Joules) of each
aircraft. Additionally,
the energy associated with the
combustion of the fuel in each fully-loaded
aircraft was estimated to be
roughly 10xE12 Joules; most of this energy was expended in the large
fireballs
(visible in TV images)
and in the subsequent burning that ignited
material in
each tower prior to and during their collapses. It
follows that less than a millionth
of the total
fuel energy in the attacking airplanes was converted to the radiating
seismic
waves.
Twelve
years ago, the World Trade Center in New York City was brought down in
a
senseless act of terrorism. But
now,
a new WTC is rising to once again be a part of the New York
skyline. A look
back at those awful
events of 11 September 2001 paints
an intriguing view of geology and seismology
as we learn more about the earth and its structure.
References
http://911research.wtc7.net/mirrors/guardian2/wtc/seismic/WTC_LDEO_KIM.htm
http://www.ldeo.columbia.edu/LCSN/Eq/20010911_wtc.html
http://www.ldeo.columbia.edu/research/seismology-geology-tectonophysics/lamont-cooperative-seismographic-network-lcsn
http://www.iris.washington.edu/about/ENO/iows/10_2002b.htm

Earthquake
Weather
Fact
or Fiction?
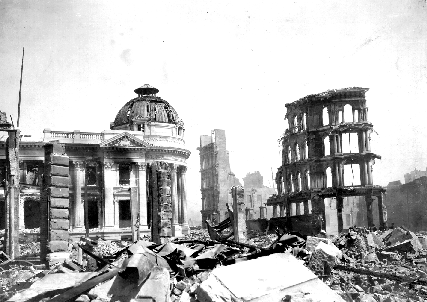
“A
heat wave in San Francisco is rare, but when one occurs, it usually
lasts three days… Tuesday, April 17, 1906,
was the first of three such days, and by evening it was still
breathlessly hot… I heard tales that horses in their stalls
were restless much of that night. This, linked with the
unseasonable weather - "earthquake weather" - some were to
call it, would be remembered by the superstitious as portents of
impending disaster… (on Wednesday morning,
April 18th) I was awakened by a violent shaking of the house
accompanied by a roar and the sound of cracking wood…
I could hear the crash of falling bricks outside..."
(from MEMORIES OF THE SAN FRANCISCO EARTHQUAKE AND FIRE OF
1906, by Howard T. Livingston)
Folklore applies the term "earthquake weather" to a sultry, ominously
uneasy period said to precede large earthquakes. Scientists
have generally dismissed suggestions that weather could have anything
to do with the tremendous underground forces associated
with an earthquake, as tectonic plates are shifting and rubbing against
one another. Yet, many people who have ample experience
with seismic events insist that quakes and weather are somehow
connected.
“Earthquake
weather” is said to be signaled by close, oppressive conditions: hot
and humid weather, with thin, wispy clouds
appearing overhead and no predicted rain. Stories
of “earthquake clouds” describe long, straight cloud forms that appear
for days
over a fault before it finally shakes. One theory is that a
squeezing motion of the earth prior to a quake generates electric
currents
that decompose trapped ground water and release hydrogen and oxygen
ions into the air, with these ions then producing the clouds
and the unusual calm characteristic of “earthquake weather.”

In the 4th century B.C., the philosopher Aristotle proposed that
earthquakes were caused by winds trapped in caves. Small
quakes
were thought to have been caused by air pushing on the cavern roofs,
and large ones by the air breaking through the earth’s
surface.
This idea said that because a large amount of air had been trapped for
some time underground, the “earthquake weather”
would be hot and calm before a quake. And ever since, many
people have pointed to various signs
of the weather as being linked to earthquakes.
Studies
have surmised that long periods of calm, quiet weather, with very high
atmospheric pressure, could result in destabilization
of the ground, triggering landslides and quakes. Some have
drawn conclusions that more quakes tend to occur in the winter than
the summer, usually when there is a surge of unusually warm
weather. Malcolm Johnston, a research geologist at the USGS
Menlo
Park California Science Center, said many earthquakes occur at depths
of six miles or greater - far removed from the
surface
weather conditions. "People have argued that you're heating
the earth...but we're talking no more than a couple of meters into
the crust," Johnston said. "Further down than that, you
wouldn't even know it's a hot day outside."
Another
theory says that it's not the temperature changes causing earthquakes,
it's that the high-pressure weather system creating
the sultry, oppressive heat is pushing on the ground, disturbing the
underlying faults. Johnston said that's unlikely.
Such a pressure
change underground, he said, would be miniscule: only on the order of
one part in 100 million. And he said that the increased
pressure on faults would actually make it harder for an earthquake to
occur, not easier.
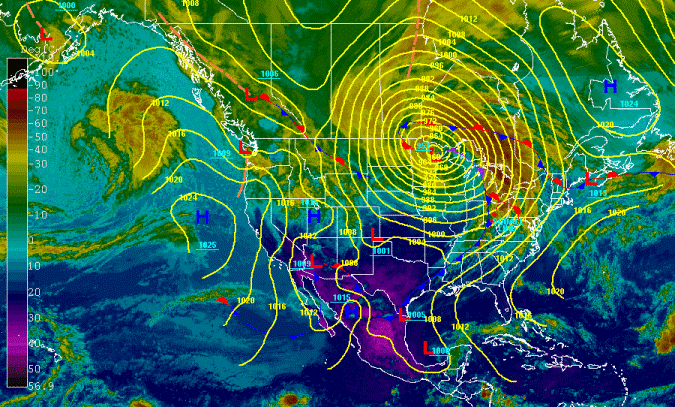
Alternatively, some recent investigations have suggested an association
of large, fast-moving low-pressure (stormy) weather
systems with initiation of ground events, theorizing that "...when
there is less force exerted upon the ground, the upward movement
of air and water molecules in the soil would serve to reduce the
friction that usually holds the soil or rocks in place, and could
trigger
certain types of slides and quakes..."(study lead William Shultz, USGS,
Denver, Colorado).
Still,
it is generally accepted in the scientific community that there is no
such thing as "earthquake weather." Statistically, there is
an
approximately equal distribution of earthquakes in hot weather, cold
weather, rainy conditions, etc. While large, dynamic surface
weather conditions might correlate to the occurrence of some very
shallow geological events, tectonic plate shifting has been
occurring rather consistently deep in the earth for millions of years,
irrespective of those weather conditions.
Some
observers may yet hold to the common misconception (dating back to the
ancient Greeks) that earthquakes are more likely
to occur during hot and dry weather; but the large majority of quakes
originate many miles underground, and so are not likely to
be influenced by surface weather conditions.

The
World’s Largest Recorded Earthquake
It is referred to as the
"Great Chilean Earthquake" and the "1960 Valdivia
Earthquake.”
With an assigned
magnitude of 9.5, it is the largest earthquake ever recorded by modern
instrumentation.
At
3:11 pm (19:11 UTC) on the afternoon of Saturday, 22 May 1960, the
devastating magnitude 9.5 (Mw) event struck
in
west-central Chile. Severe damage from shaking occurred in
the
epicentral Valdivia-Puerto Montt area. Although
there are many different casualty estimates for this earthquake ranging
from a low of 490 to a high of "approximately 6000,"
most historical reports place this figure at 1655 deaths.
Much of the damage and many of the casualties were due to large
tsunamis which caused damage along the coast of Chile and in many areas
across the Pacific Ocean, where fatalities
from this quake were recorded as far away at the Philippines.
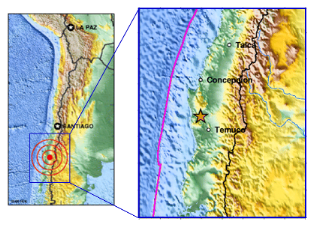
Magnitude 9.5 Earthquake
Epicenter Location in West-Central Chile
The epicenter was near Lumaco, Chile, some 570 kilometers (km), or
about 350 miles (mi) south of Santiago, with Temuco being
the
closest large city, while Valdivia, Chile was the most affected city.
An estimated 2,000,000 people were made homeless,
and $550
million in damage was totaled, in central-southern Chile. The
tremor caused local tsunamis that severely damaged Chilean
coastal
areas with waves up to 25 meters (m), or about 82 feet (ft)
in
height. The tsunami moved rapidly across the
Pacific Ocean,
causing additional damage all across this wide region. Waves
as high as 10.7 m (35 ft) were recorded some 10,000 km (6,200 mi)
from the epicenter. Seismologists monitored world-wide
micro-seismic vibrations that, “like the ringing of a bell,”
persisted in the earth for days after the quake had occurred.
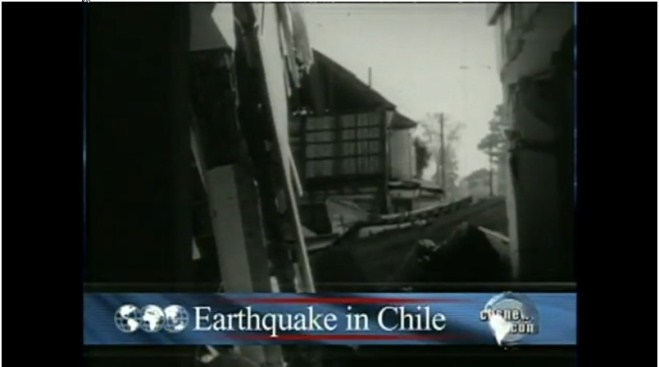
Video: February 2010 Report by CBS News on
Chilean M9.5 Earthquake
Just
off the Pacific coast of Chile and the rest of South America, the Nazca
tectonic plate is
subducting beneath the edge of the South America plate. The convergence
associated with this
subduction process is responsible for the uplift of the Andes
Mountains, and for the active volcanic chain
present along much of this area. Relative to the South
American plate, the Nazca plate is moving
north-northeastwards at a rate that varies from about 80 millimeters
per year in the south to
approximately 65 millimeters per year in the north, giving rise to
volcanic activity, crustal deformation,
and earthquakes all along the western coastline of South America.
Numerous
large earthquakes have occurred in the western Chilean coast region
before and after the historic quake on May 22nd.
The M9.5 event was a megathrust earthquake that had a focal depth of 33
km (20.5 mi). It was estimated to have produced a
rupture
zone some 1000 km (612 mi) in length, extending from Lebu, to Puerto
Aisen, one of the longest tectonic ruptures ever reported.
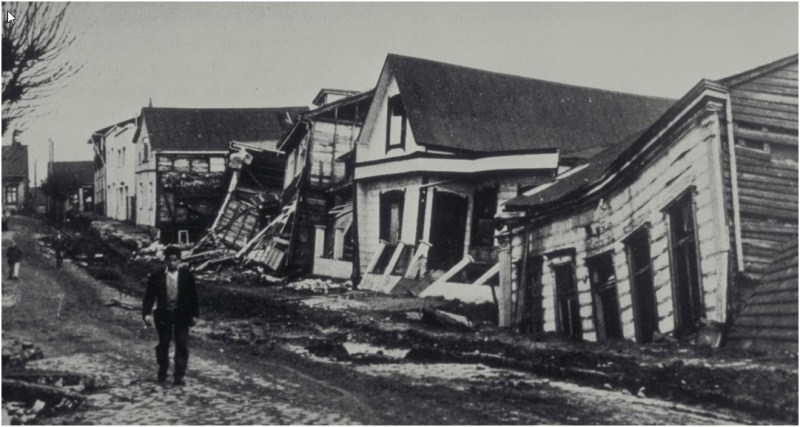
Damage
in Chile near M9.5 Earthquake Epicenter
Land
subsidence caused by the earthquake produced local flooding and
permanently altered the shorelines of much of the
epicentral
area in Chile. Many landslides occurred Chilean
hillsides.
A 1-1.5 m (3-5 ft) of ground subsidence occurred
along the
Chilean coast from the south end of the Arauco Peninsula to Quellon on
Chiloe Island. As much of 3 m (10 ft) of
ground uplift
occurred on Isla Guafo. Many landslides occurred in the
Chilean
Lake District from Lago Villarica to Lago Todos los Santos.
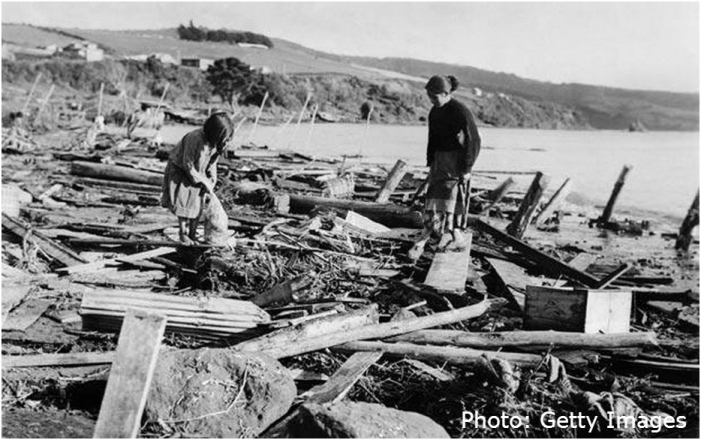
Costal
Damages Caused by Tsunami following M9.5 Earthquake in Chile
In
the epicentral area, the town of Puerto Saavedra was completely
destroyed by tsunami waves which reached heights
of 11.5 m (38 ft) and carried remains of houses inland as much as 3 km
(2 mi). Wave heights of 8 m (26 ft) caused much damage
at the seaport town of Corral.
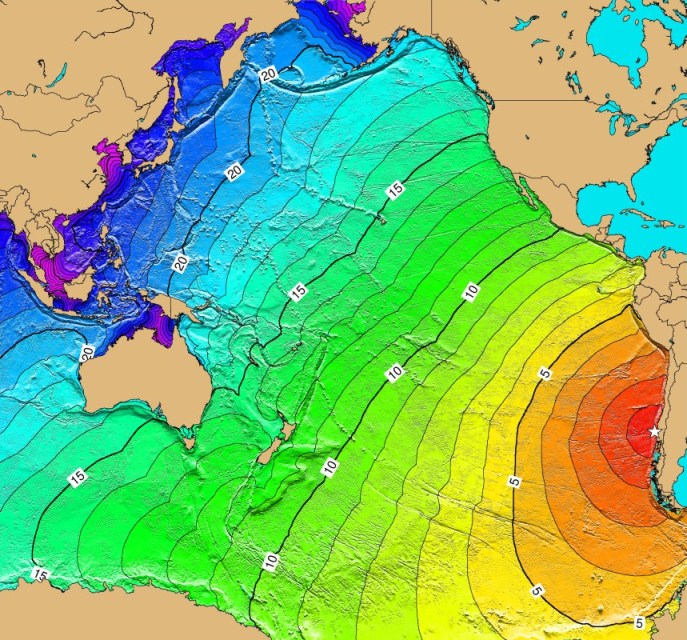
Tsunami
Movement Across the Pacific Ocean Following M9.5 Earthquake in Chile
Some 18
hours after the
quake occurred, tsunamis
caused 61 deaths and severe damage in Hawaii,
mostly at
Hilo, where
the wave runup height reached
10.6 m (35 ft). The Hawaiian
office of Civil Defense totalled
some $24 million in damages caused by the tsunami..
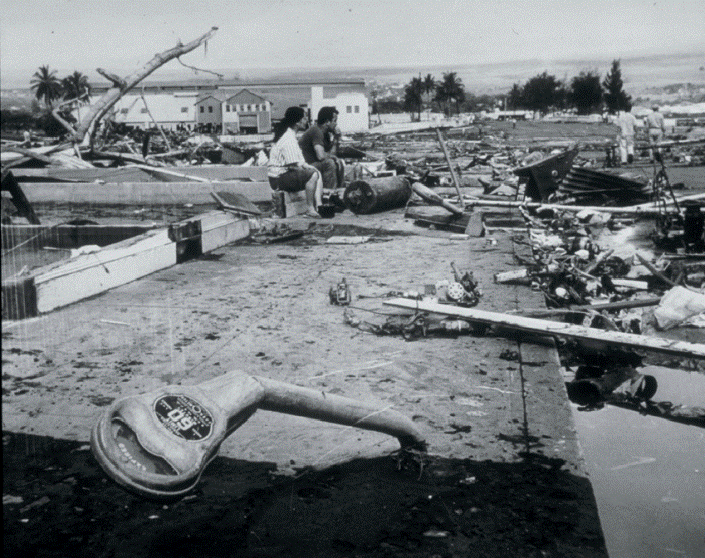
Tsunami
Damage in Hawaii from Chile 9.5 Earthquake
Waves as
high as 5.5 m (18 ft) struck northern Honshu, Japan, about 22 hours
after the quake had occurred.
The tsunami destroyed more than 1600 homes in Japan, and left
as many as 185 people dead or missing,
with an estimated $50 million in damage.
Another
32 people were dead or missing in the Philippines after the tsunami hit
those islands.
Damage also occurred on Easter Island, and in the Samoa Islands.
Along
the western coast of the United States, major damage was reported at
Crescent City, and in the Los Angeles and
Long Beach harbor areas, where many small craft were set adrift and
some were sunk in the incoming tsunami waves
which had a height reported to be 1.7 meters (5.6
feet). Total damage was estimated at $500,000 to $1,000,000
on the west coast of the United States.
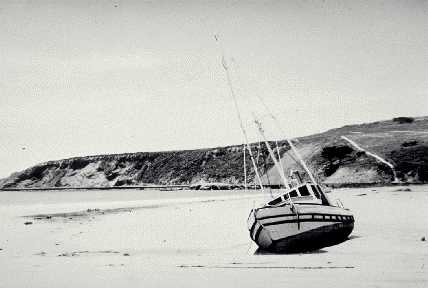
Damaged
Ship on California Coastline from Chile M9.5 Earthquake and Tsunami
On
May 24th, two days after the earthquake had occurred, Volcan
Puyehue erupted, sending ash and steam
as high as 6,000 m (almost 20,000 ft) The
volcanic eruption continued for several weeks after the earthquake.
The
M9.5 quake was preceded by four foreshocks larger than magnitude 7.0,
including a magnitude 7.9 quake on May 21st
that had already caused severe damage in the Concepcion area.
Many aftershocks occurred following the May 22nd mainshock,
with five of these recorded at magnitude 7.0 or greater, through
November 1, 1960.
The
death toll from this huge earthquake was less than it might have been
because it occurred in the middle of the afternoon
when
much of the population was out of doors; because many of the
local
structures had been built to be earthquake-resistant;
and due to
the several strong foreshocks in the area that had already made the
population somewhat wary of additional quake activity.
Because the region is situated on a the long tectonic fault boundary
between the Nazca and South American plates,
seismologists believe that it is only a matter of time until Chile once
again suffers a "world-class" earthquake whose impact,
like the M9.5 event in 1960, will be felt around the world.

The Seismic
Signature of Tornadoes
Scientists
have long considered the possible connections between violent weather
phenomena and low-frequency ground
vibrations detectable by seismographs. In more recent years,
several examples have been documented where the ground track
of a tornado near seismic stations has been correlated to unusual
seismic activity recorded by the seismograph equipment.
A
1994 paper by researchers in Huntsville, Alabama and at the University
of Alabama (“Tornado Detection Based on
Seismic Signal,” Tatom/Knupp/Vitton; 18 July 1994) discusses the
mechanisms by which energy could be transferred to the
ground
by a tornado, resulting in patterns of local ground vibrations and
low-frequency seismic surface waves which may be
detectable by seismographs in the area. Though no
specific examples of this energy transfer are described,
the paper nonetheless ponders the question of future research and
development of suitable sensors.
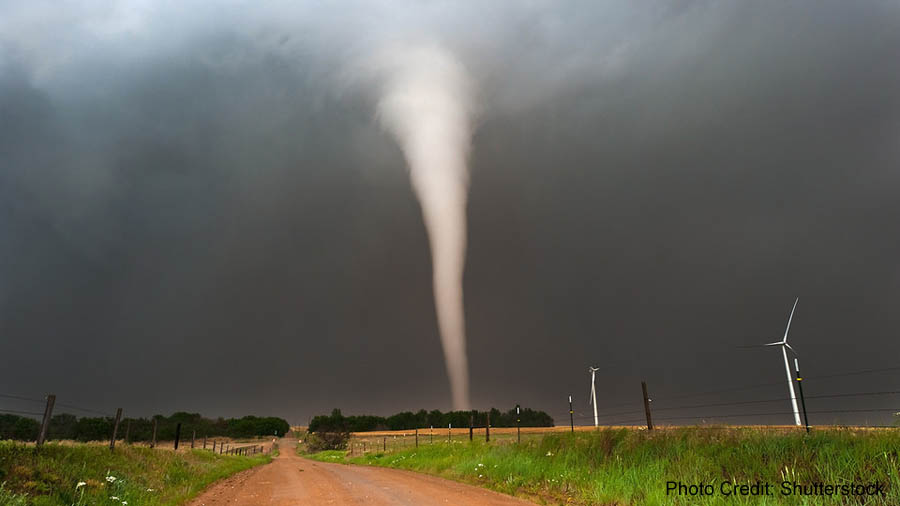 In
a 1999 study, micro-seismic noise levels were recorded in Ohio for some
2 hours prior to, and 30 minutes following,
a powerful EF4 tornado that touched down in a Cincinnati suburb on
April 9th. Seismologists were able to correlate
distinctive changes in the amplitude and envelope of low-frequency and
high-frequency noise content in the data produced
by several local seismographs as the tornado approached on the ground
nearby, and then continued out of the area.
In
a related investigation, a scientist at NOAA’s Environmental Technology
Laboratory at Boulder, Colorado, was working
with an acoustic sensor designed to detect low-frequency sound waves
produced by an avalanche, when he witnessed the
instrument
detecting signals from a tornado passing some 14 miles away in the
area. In further studies of pickup of the
1-5 Hz sounds that tornadoes may generate, the avalanche observing
system detected 27 other tornadoes, some as far
as 100 miles away (see “Scanning the Skies: A History of Tornado
Forecasting” by Marlene Bradford).
A
strong tornado touched down in a path from Henderson County, Kentucky
to
Warrick County, Indiana on November 6, 2005, killing 25 people and
injuring
many more, and causing extensive damage to homes and
businesses.
Ground
vibrations that correlated to the time of the tornado were observed
on
home-built equipment constructed by an amateur seismologist
at
his residence in Evansville, Indiana.
More
recently, in conjunction with the National Science Foundation’s
“EarthScope” program, scientists from Indiana University
Bloomington participated in the deployment of an array of over 100
seismographs in the area around Harrisburg, Illinois.
EarthScope seeks to cover the entire U.S. with a grid of detection
devices to better understand seismic activity and the
potential for earthquake predictions. Researchers liken
EarthScope to “an upside-down telescope” that allows them to look
into the Earth and gain a better understanding of seismic
forces.
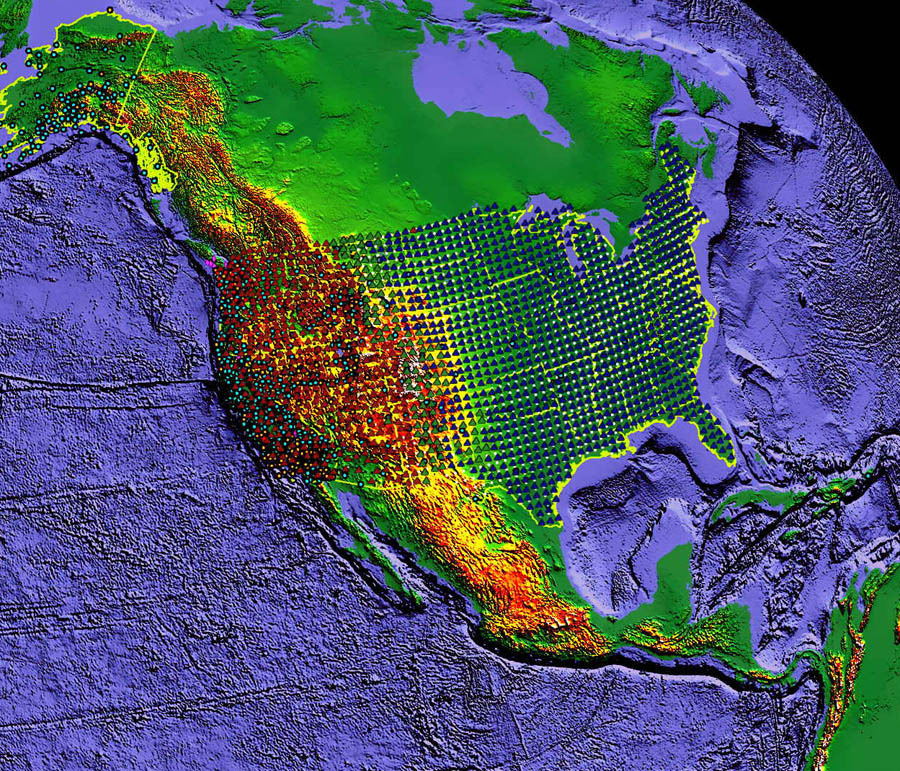 EarthScope
Planned Seismograph Array Deployment
(Graphic
Credit: Earthscope)
On
February 29, 2012, a pre-dawn EF4 tornado passed through the Harrisburg
area with estimated wind speeds
around 180 miles per hour, killing six and injuring over 100
people. In the deployed array of EarthScope seismographs,
three stations in southern Illinois showed unusual seismic
activity during the time period when the tornado was passing
through the area, even though there were no earthquakes occurring at
that time.
Intrigued
by their data, the Indiana University scientists conducted a post-storm
investigation and said in announcing
the results of their study, “The seismograms show a strong,
low-frequency pulse beginning [before the tornado’s touchdown]
around 4:45 a.m. on February 29. Our preliminary
interpretation, based on other seismic records of tornadoes, suggests
that we were recording not the tornado itself, but a large atmospheric
pressure transient related to the
large thunderstorms that spawned the tornadoes.”
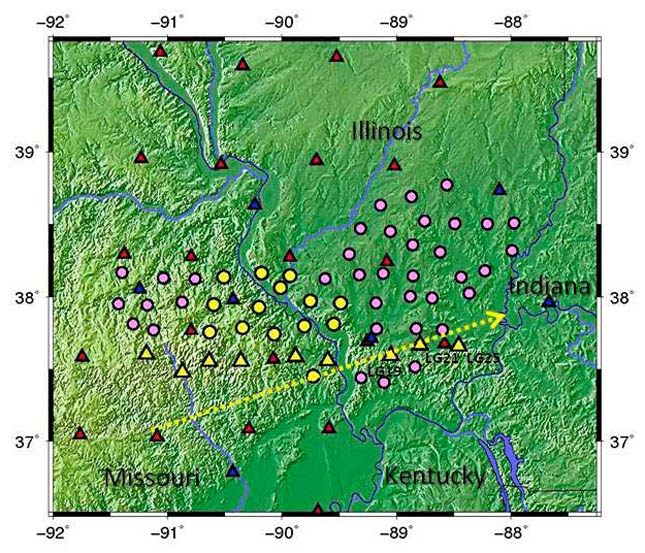 Deployed
Seismographs and Approximate Path of February 29, 2012 Tornado
(Graphic
Credit: Indiana University Bloomington)
Further
analysis of the micro-seismic activity noted in seismograms recorded
during the February tornado related
a change in atmospheric pressure prior to the tornado forming and
touching down to the ground, to a small,
slow tilting of the ground at the seismic
stations that lasted for several minutes. This might be
visualized by imagining the
end of a vacuum-cleaner hose held close to the surface of a bedsheet or
other thin fabric cover, and moved slowly across
the fabric while the vacuum is operating. Note how the
low-pressure area at the end of the hose created by the vacuum's
suction
will lift up a small, local section of the fabric as the hose is
moved. A similar action might be imparted to the earth's
surface as the low-pressure area associated with a tornado's formation
moves through the area.
The
scientists say this pressure-related signal might help better our
understanding of atmospheric activity that takes place as
tornadoes
are being formed. One seismologist has asserted that
because seismic signals can travel faster as in-ground
vibrations than the actual storm (seismic waves in the ground travel
many times faster than do sound waves in the air),
a seismograph buried underground might give advance notice of an abrupt
change in the local atmospheric pressure many
miles away: "There is a huge pressure difference differential between
the center of the storm and outside of the storm and that
puts [an
increased and decreased] weight on the surface of the earth. So it's
compressing the earth differently.”
While
these past examples and observations do show a connection between
tornadoes and micro-seismic activity,
much more research remains to be done in this interesting area of earth
science. One day it may be possible to construct
algorithms that, through seismic observations, could work
with advanced radar capabilities in the prediction of tornado
formation and paths. However, compared to the study of a
broad-area weather event such as a hurricane, the strong
effects
of a tornado are seen in a relatively small straight-line area, and so
a challenge facing researchers in the study of tornadic
seismic
signatures is a need for suitable detectors that are found to be
located along or near the storm’s path. Continued work
with programs such as EarthScope, that deploy more
ground-truth instruments, may aid in addressing this
need.
 "Though the
Earth be Moved"
The
1964 Great Alaska Earthquake…therefore
will we not fear, though the earth be moved,
and
though the hills be carried into the midst of the sea…
Psalm 46:2 (MSTC)
Acknowledging the 50th
anniversary of the 1964 Great Alaska
Earthquake, the United States
Geological Survey released in 2014 a documentary video about that event. The video is located at
https://www.usgs.gov/media/videos/1964-quake-great-alaska-earthquake, and highlights the impacts and
effects
of the quake which, at magnitude 9.2, is
the largest recorded earthquake ever
to strike in the United States.
____________________________________________
“…
at 5:36, a dozen miles deep, under the mountains north of Prince
Williams Sound, the earth shifts and begins
to move… suddenly, the whole harbor at Valdez begins to empty, and
drains almost dry… out in the Gulf of Alaska,
the ocean bottom plunges, then heaves upward a full 50 feet, and a wave
starts racing to shore… now the tremor builds
and rips like lightning around the 500 mile arc… at 5:44, the seismic
wave hits Seward… it strikes Kodiak later, first a
high silent tide, then a 40-foot monster thundering up the
channel… all the clocks have stopped at 5:36,
and so has everything else…” (
from the
1965 documentary film “Though the Earth Be Moved”)
____________________________________________
It
has been called the Great
Alaska
Earthquake, the Good
Friday Earthquake, and the Portage Earthquake.
The massive tremblor struck at 5:36 pm Alaska Standard Time, on Friday,
March 27, 1964, in the northern part
of the Prince William Sound about 75 miles east of Anchorage,
Alaska. With a moment magnitude of 9.2, it remains
the largest earthquake seen in North America and the second-largest
quake ever recorded worldwide.
The earthquake shaking lasted almost 4 minutes, triggering many
landslides and avalanches in the area.
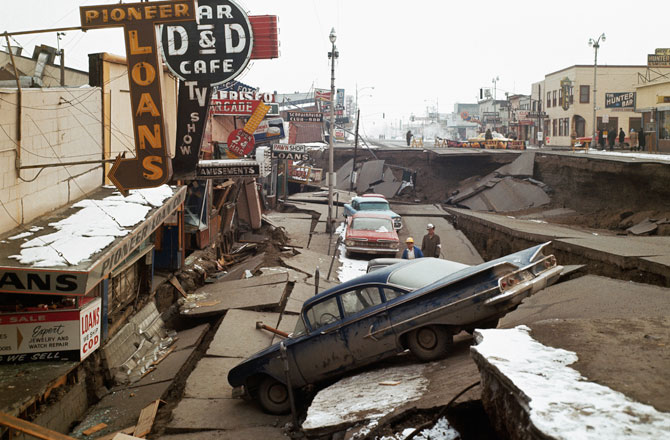
Collapse of Fourth Avenue near C Street in Anchorage, Alaska
Good Friday Earthquake, March 27, 1964 (U.S. Army
Photo)
Vertical
ground displacement caused by the earthquake was seen over an area of
about 200,000 square miles,
causing a maximum of about 38 feet of ground uplift to as much as 8
feet of subsidence, relative to sea level.
On land, the shaking led to extensive property damage across a broad
area of an estimated 100,000 square miles
of southern Alaska. In the coastal waters, movement of the
seafloor generated a major tsunami that had a major
impact on the southeast coast of Alaska, the Pacific Coast of British
Columbia, and the west coast of the United States.
The quake also caused at least five local landslide-generated tsunamis
in the region within minutes after the
shaking began. One eyewitness reported the water rising 15
feet in 5 seconds at Kodiak, Alaska.
Total
property damages due to the earthquake were estimated at some $350-500
million in 1964 dollars, a figure
equivalent to several billion dollars today. Across
south-central Alaska and surrounding areas, earthquake-generated
ground
fissures, collapsing structures, and regional tsunamis led to a total
of 131 deaths. A very small number of fatalities
was attributed to the earthquake itself, with the large majority of
deaths due to the ensuing tsunami. Research conducted
after the earthquake indicated that the surface energy released by the
shock was roughly equivalent to the detonation of
100 million tons of TNT, or the force of about 63,000 atomic bombs the
size of the one
dropped on Hiroshima, Japan in 1945.
The
city of Anchorage suffered the greatest damage to residences,
commercial buildings, and infrastructure such as
paved streets and sidewalks, water and sewer mains, and electrical
utility systems. About 30 blocks of dwellings and
commercial buildings were damaged or destroyed in the downtown
Anchorage area. The schools in Anchorage were
almost completely destroyed. Nine immediate deaths occurred
in the local area: five in downtown Anchorage, three in
Turnagain
Heights, and one at the International Airport. The death toll
in
the region near the quake epicenter was unusually
small for an event of this severity, because of Alaska’s low population
density (at the time), and because the quake
occurred on a holiday (Good Friday) when schools and businesses were
closed, in the late afternoon when most people
were at home. Also, the wood construction used for many area
homes was more flexible than concrete, and could bend
more without collapsing. Nonetheless, earthquake effects were
substantial in many population centers, including
Anchorage, Chitina, Glennallen, Homer, Hope, Kasilof, Kenai, Kodiak,
Moose Pass, Portage, Seldovia, Seward,
Sterling, Valdez, Wasilla, and Whittier.
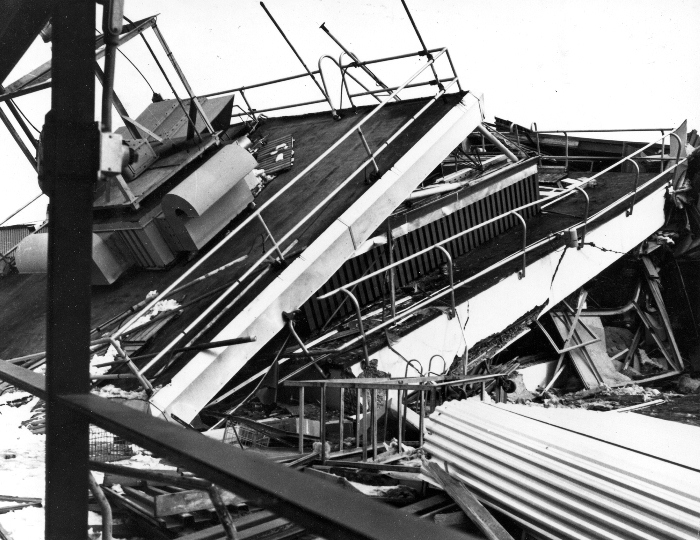 Collapse of Anchorage
International Airport Control Tower
Good
Friday Earthquake, March 27, 1964 (FAA Photo)
The
port of Valdez in Prince William Sound saw a massive underwater
landslide that resulted in the deaths of 32 people
in the collapse of the Valdez city harbor and docks, and damages to the
ship Chena that was docked there at the time.
Southwest of Kodiak, some areas of land were permanently raised as much
as 30 feet, while the ground level was
lowered significantly in some areas near the towns of Portage and
Girdwood. The area of subsidence covered some
110,000 square miles, including the north and west parts of Prince
William Sound, the west part of the Chugach Mountains,
most of Kenai Peninsula, and almost all the Kodiak Island
group. With the subsidence and subsequent tidal inrush,
people
living in the community of Girdwood and other areas relocated further
inland, while the town of Portage was abandoned.
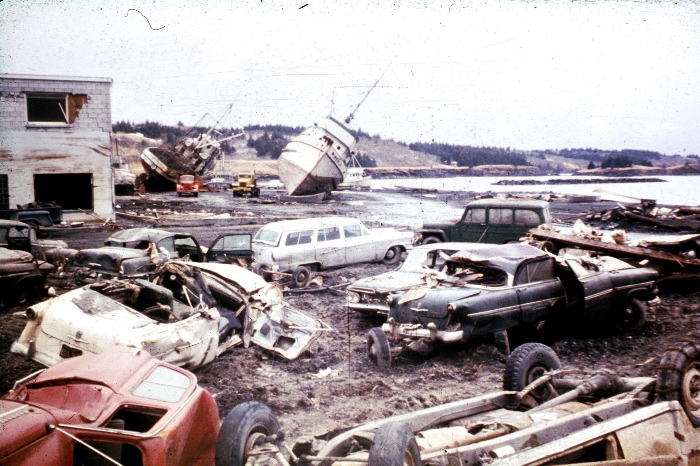
Tsunami Damage at Kodiak, Alaska
Good
Friday Earthquake, March 27, 1964 (USGS
photo)
The
quake-generated tsunami devastated many towns in coastal areas along
the Gulf of Alaska, and left extensive
damage at Whittier, Seward, and Kodiak; at Alberni and Port Alberni,
Canada; in British Columbia; and along the West
Coast of the United States. The initial wave attained a speed
of more than 400 miles per hour, and traveled a total of
some 8,400 miles. A maximum wave height of 220 feet was seen
at Valdez Inlet. The village of Chenega was destroyed,
with 23 deaths recorded there, by the tsunami which measured 27 feet in
height at that location.
Along
the western coast the United States, the tsunami killed 12 people and
caused an estimated 17 million dollars
in damage in California. The wave flooded a large portion of
Crescent City, killing 10 and causing approximately 15
million dollars in damage. At San Francisco, the tsunami,
though only about 3 feet high, caused an estimated 1 million
dollars in damages in that area. The State of
Oregon saw four deaths and extensive damages to bridges, houses, cars,
boats,
and sea walls, due to the tsunami. Across the wider northern
Pacific region, tsunamis caused damage in Hawaii
and Japan, and there was further evidence reported from all over the
earth of effects related to the quake.
Seiche
action (water sloshing in contained areas) caused minor damage in
rivers, lakes, bayous, and protected harbors
and waterways along the Gulf Coast of Texas and Louisiana. The tsunami
was recorded by tide gages throughout the
Pacific, and sea level oscillations caused by the quake were
recorded in Cuba and Puerto Rico. Sloshing water was
observed in wells as far away as Africa.
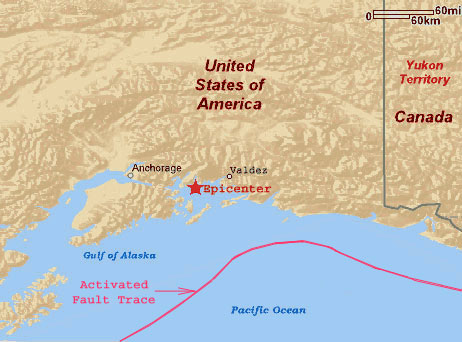 Epicenter
Location and Tectonic Fault Zone
Good
Friday Earthquake, March 27, 1964
(Original
base map by Mapquest)
The
earthquake was caused by a rupture in the crustal
fault between the Pacific Plate and North American Plate
near College Fjord in Prince William Sound. This
part of the “Pacific Ring of Fire” is a tectonic subduction zone,
with the Pacific Plate moving beneath the edge of the North American
Plate at a rate of some 50 to 70 millimeters
per year, causing the crust of southern Alaska to be compressed and
twisted under the strain. Over time, some coastal
areas were being slowly depressed while others were raised up as the
tectonic pressures increased along the locked
plate boundary. On March 27th, the boundary could no longer
sustain the stress, and, after a period that may have lasted
for centuries, the built-up strain and compression was relieved by the
sudden slippage and resultant southeastward
movement of portions of coastal Alaska, as the North American Plate
moved back over the subducting Pacific plate.
The
fault rupture began at an estimated underground focal depth of
approximately 15.5 miles, north of
Valdez and the upper Prince William Sound, with the major area of
uplift trending northeast from southern Kodiak Island to
Prince William Sound and continuing to the east of the sound.
Investigations indicate that, from the
underground focus,
the fault rupture also proceeded westward along the tectonic plate
boundary over a distance of some 500 miles to an area
southwest of the Trinity Islands in the Gulf of Alaska. The
net result of the fault rupture and plate boundary slippage,
in relieving the pressure built up for
centuries, was
a further movement of the Pacific plate underneath
the North American plate by an average of some 30 feet.
“Magnitude
measurements varied, depending on the scale used. The reported Richter
magnitudes
ranged from 8.4 to 8.6. (Later, it was found that the Richter didn't
measure accurately beyond 8.0.)
The surface-wave magnitude (Ms) was 8.6. The moment magnitude (Mw) was
9.2. Most of that energy
was absorbed by the ocean and land, but much man-made construction
couldn't withstand the remainder.”
(from
“The Great Alaskan Quake of 1964” by U-S-History.com)
Thousands
of aftershocks were recorded by seismologists in the months following
the M9.2 earthquake’s main shock.
During the next day, 11 aftershocks with magnitudes greater than 6.0
were registered. In the next three weeks,
nine more aftershocks were observed, and smaller aftershocks continued
to be detected in the region for more than a year.
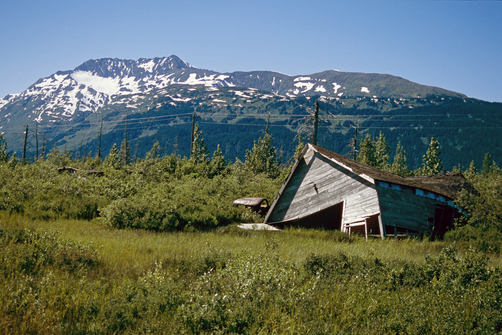 Abandoned Portage, Alaska Townsite
Good
Friday Earthquake, March 27, 1964 (National
Geographic Photo)
Scars
from the devastating earthquake can still easily be seen in the
landscape of southern Alaska’s coastal areas.
Virtually destroyed in the earthquake, the town of Portage was
abandoned. With damage being furthered by time and
the elements of Mother Nature, evidence of the few remaining
buildings at the Portage townsite are slowly disappearing
among the new marshy growth of what was once dry ground.
Trees that once grew here are located by dead trunks,
having been killed
by the salt-water marsh created when the land subsided and ocean waters
flooded the area during the
earthquake. Since that time,
continuing tectonic processes are again building stresses in the
crustal material underlying the
region, with a growing potential for another significant
earthquake in this seismically active part of the world.
____________________________________________
References
“Though the Earth Be Moved” Documentary Film (1965),
United States Office of Civil Defense
http://www.youtube.com/watch?v=-9Si4D-SD2I
United States Geological Survey (USGS)
http://earthquake.usgs.gov/earthquakes/states/events/1964_03_28.php
http://www.usgs.gov/newsroom/article.asp?ID=106
Alaska Earthquake Information Center
http://www.aeic.alaska.edu/quakes/Alaska_1964_earthquake.html
University of Arizona Geosciences Program
http://www.geo.arizona.edu/~nhartnes/alaska/index.html
University of Southern California Tsunami Research Group
http://www.usc.edu/dept/tsunamis/alaska/1964/webpages/index.html
The Great Alaskan Quake of 1964
http://www.u-s-history.com/pages/h2101.html

Anatomy of
a Mega-Quake
A brief look
back at the Great Tohoku Earthquake, March 11, 2011
Update,
04 March 2014: "In
a poll conducted by Kyodo News, more than fifty percent
of the 42 mayors of towns,
villages and cities from
the Tohoku region of
northeastern part of Japan struck by the March 2011 earthquake
and
tsunami
believe that recovery has slowed down or halted ... even if residents
have
evacuated to keep away from the
radiation leaking out
of the nearby power
plant, no [new] developments have been made ... while deaths from
the
March
2011 disasters
reached 15,884 according to the National Police Agency, 2,636
people are still unaccounted
for by February 10, just
short of three years
after they happened..." - Japan Daily Press,
March 03, 2014
The
ground in the Tohoku region of the northern island of Honshu, Japan,
began
rumbling on March 9, 2011, with a series of large earthquakes in
the area measuring
over magnitude 6 and peaking at magnitude 7.2. This was not
considered highly
unusual in Japan, given the region’s familiarity with
earthquakes.
But two days
later, everything would change.
At
2:46 pm (Japan local time) on the afternoon of March 11, 2011, a
massive magnitude 9.0 earthquake, the world’s fifth
largest seen
since 1900, struck off the northeastern coast of Honshu.
Strong ground shaking lasted three or more
minutes
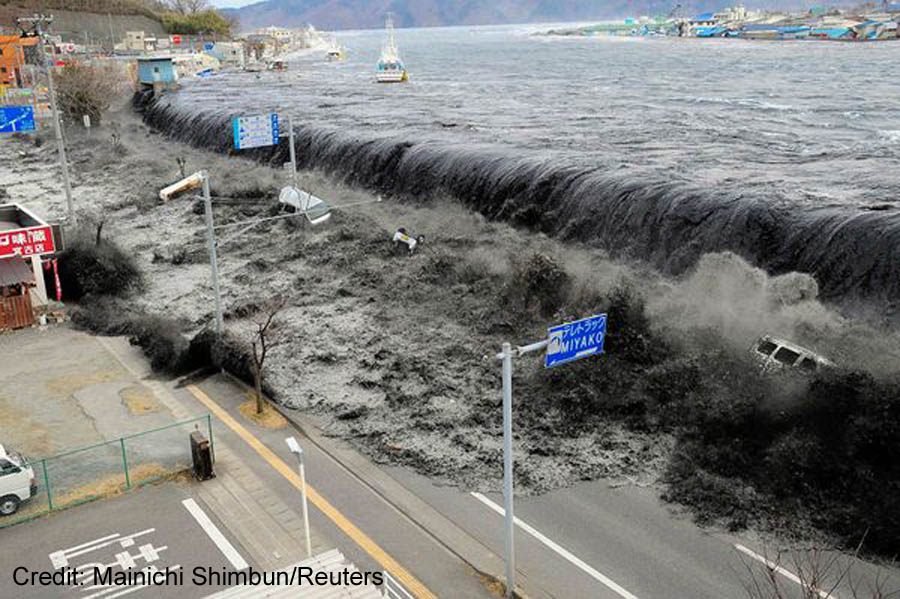
in some places. The offshore earthquake generated a major
tsunami wave that resulted in widespread
property
damage and destruction in the nearby coastal areas of Honshu, and the
deaths of many thousands
living
in the region. The tsunami damaged the Fukushima Nuclear
Power Plant, disabling the emergency
generators
needed to cool the reactors and leading to nuclear meltdowns and
extensive radiation leaks.
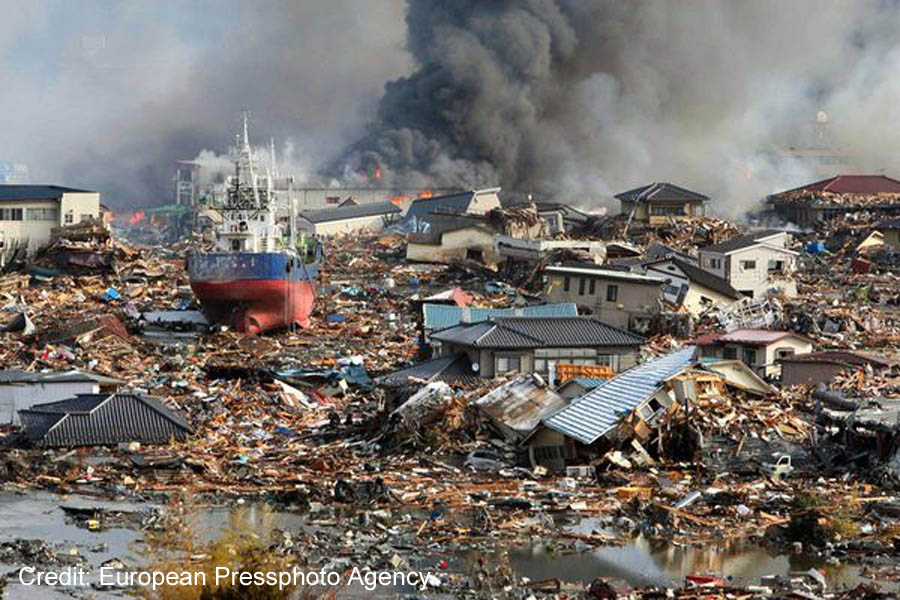 A
staggering scene of destruction was left behind when the earthquake
shaking and tsunami subsided.
At
least 15,703 people had been killed, 4,647 were missing, 5,314 were
injured, and over 130,000 were
displaced,
along the entire east coast of Honshu from Chiba to Aomori.
Property damages included at least
332,395
buildings, 2,126 roads, 56 bridges and 26 railways destroyed or damaged
in these areas. The total
economic
loss in Japan was estimated at 309 billion US dollars.
Outside of Japan, one person was killed
and
several houses were destroyed at Jayapura, Indonesia, by a tsunami with
a wave height of 2 m. In the United
States,
one person was killed south of Crescent City, California, and several
boats and docks were destroyed or
damaged
along the coast with estimated damages exceeding $50 million, by a
tsunami with a
recorded
wave height of 2.47 m.
A
staggering scene of destruction was left behind when the earthquake
shaking and tsunami subsided.
At
least 15,703 people had been killed, 4,647 were missing, 5,314 were
injured, and over 130,000 were
displaced,
along the entire east coast of Honshu from Chiba to Aomori.
Property damages included at least
332,395
buildings, 2,126 roads, 56 bridges and 26 railways destroyed or damaged
in these areas. The total
economic
loss in Japan was estimated at 309 billion US dollars.
Outside of Japan, one person was killed
and
several houses were destroyed at Jayapura, Indonesia, by a tsunami with
a wave height of 2 m. In the United
States,
one person was killed south of Crescent City, California, and several
boats and docks were destroyed or
damaged
along the coast with estimated damages exceeding $50 million, by a
tsunami with a
recorded
wave height of 2.47 m.
 The
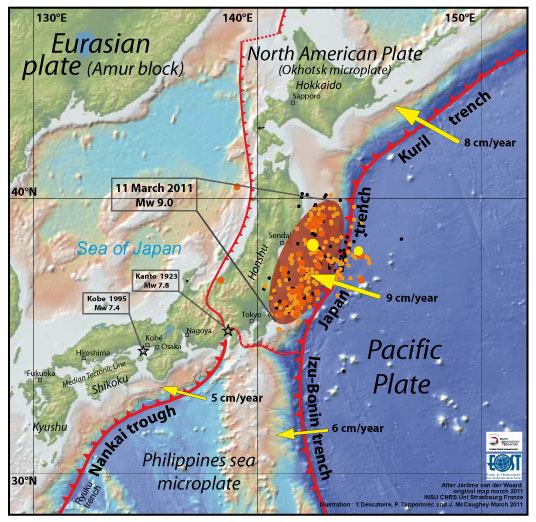
Tohoku M9.0 earthquake resulted from thrust faulting on or near the
tectonic plate subduction zone boundary
along
the Japan Trench just off the eastern coastline of Honshu, where the
Pacific Plate is slowly moving back
into
the earth’s mantle beneath the edge of the North American
Plate. Strong earthquakes that result from the
subduction
of tectonic plates usually occur on plate segments that rupture singly
or in combination, and in the past,
relatively
small areas of plate segments in the Japan Trench have slipped
sequentially, causing notably
damaging
earthquakes. However, during the March 11, 2011 Tohoku quake,
several large-area
subducting
plate segments Japan slipped simultaneously, something that may not
have previously occurred in
that
place for over a thousand years.
 GPS
units operating during the quake sampled ground movement in the
epicentral area at 1 second increments
during
the earthquake, showing that a 4 m eastward expansion, and a 1 m
coastal subsidence, of the Honshu
mainland
occurred during the plate slippage sequence, and was accompanied by the
radiation of 50-100 km
wavelength
seismic surface waves.
 The
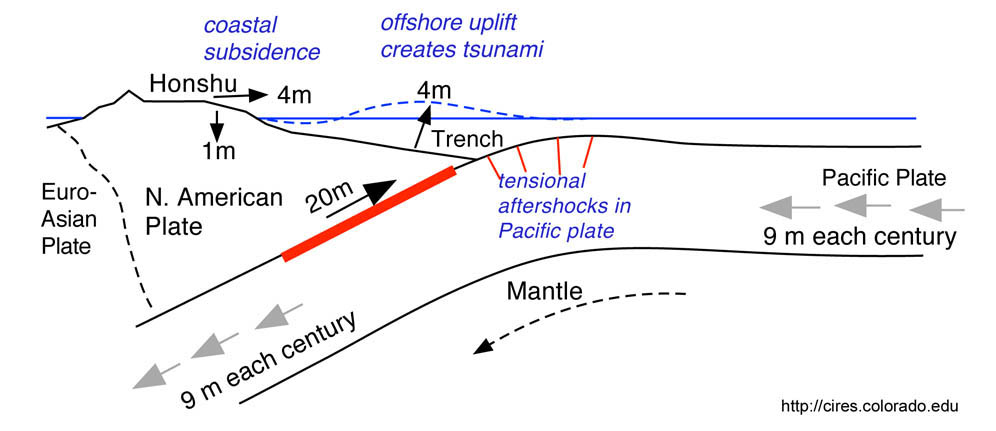
graphic above shows an East-West section through the Honshu coastline,
with the Pacific Plate
subducting
at some 90 millimeters/year (USGS reports place this movement at a rate
of 83 mm/yr) beneath the
North
American Plate, and the location of the main plate boundary rupture
ending close to the shore at 30-40 km depth.
The
rupture is shown moving 20 m along the fault, while some further
studies have modeled this at 30-40 m.
The
main fault rupture caused the coastal subsidence (lowering the
pre-earthquake shoreline by up to 1 m) and the
undersea
uplift which created the subsequent devastating tsunami. Some
more extensive studies have suggested
that
the plate movement was more dramatic than originally modeled, with a
horizontal slip of around 50 m and
vertical
movement of up to 10 m.
The
graphic above shows an East-West section through the Honshu coastline,
with the Pacific Plate
subducting
at some 90 millimeters/year (USGS reports place this movement at a rate
of 83 mm/yr) beneath the
North
American Plate, and the location of the main plate boundary rupture
ending close to the shore at 30-40 km depth.
The
rupture is shown moving 20 m along the fault, while some further
studies have modeled this at 30-40 m.
The
main fault rupture caused the coastal subsidence (lowering the
pre-earthquake shoreline by up to 1 m) and the
undersea
uplift which created the subsequent devastating tsunami. Some
more extensive studies have suggested
that
the plate movement was more dramatic than originally modeled, with a
horizontal slip of around 50 m and
vertical
movement of up to 10 m.
 The
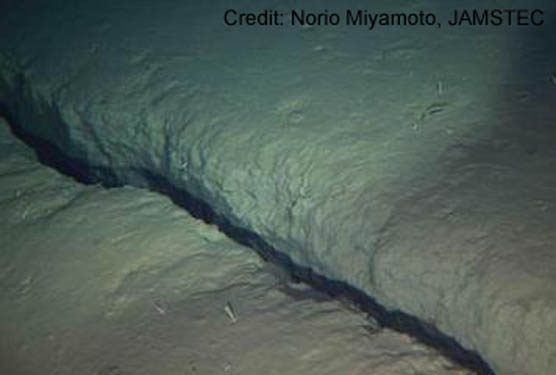
quake opened up cracks as wide as 2 m (6.3 ft) in the seafloor, where
clam beds once lay.
A
photograph of the seafloor (above) was made on August 10, 2011 off the
coast of Japan after the earthquake,
showing
a 20 cm ( 8-in) wide opening that stretches for tens of meters or more
in a north-south direction at an
undersea
depth of 3,218 m (10, 558 ft). The depth of the crack itself
could not be determined.
The
seismic moment, a measure of the total amount of energy released by the
quake,
The
quake opened up cracks as wide as 2 m (6.3 ft) in the seafloor, where
clam beds once lay.
A
photograph of the seafloor (above) was made on August 10, 2011 off the
coast of Japan after the earthquake,
showing
a 20 cm ( 8-in) wide opening that stretches for tens of meters or more
in a north-south direction at an
undersea
depth of 3,218 m (10, 558 ft). The depth of the crack itself
could not be determined.
The
seismic moment, a measure of the total amount of energy released by the
quake,
was calculated to be 3.9E+22
Joules, equivalent to the detonation of some 617 Hiroshima-sized
atomic bombs. Only about 0.005% of
this total energy, or some 1.9E+18 Joules, was calculated
to have been radiated as seismic waves.
The
entire fault rupture process was estimated to have lasted about three
minutes, with some 70% of the seismic
moment
released during the first half of the rupture duration time, when the
fault disturbance remained confined in a
100–150
km wide slab segment in the northern part of the fault. The
rupture process then spread in a southwest
direction,
eventually covering an area approximately 450 km long and 150 km wide.
The
Great Tohoku Earthquake has been classed as “an infrequent
catastrophe,” and has become one of the most
extensively-examined
earthquakes in modern times. Some studies have found that,
based on seismic modeling
results
and GPS data, the horizontal movement along the tectonic plate
interface near the epicentral area represents
roughly
400 years of accumulated tectonic strain in the Japan Trench
region. The earthquake’s fault motion and
intensity
far surpassed that of other quakes of the 20th century in this area,
none of which were as intense as
magnitude
8. A similar quake may have occurred on July 13, 869, when
historical records show that the area
east
of Sendai was apparently engulfed by a large tsunami.
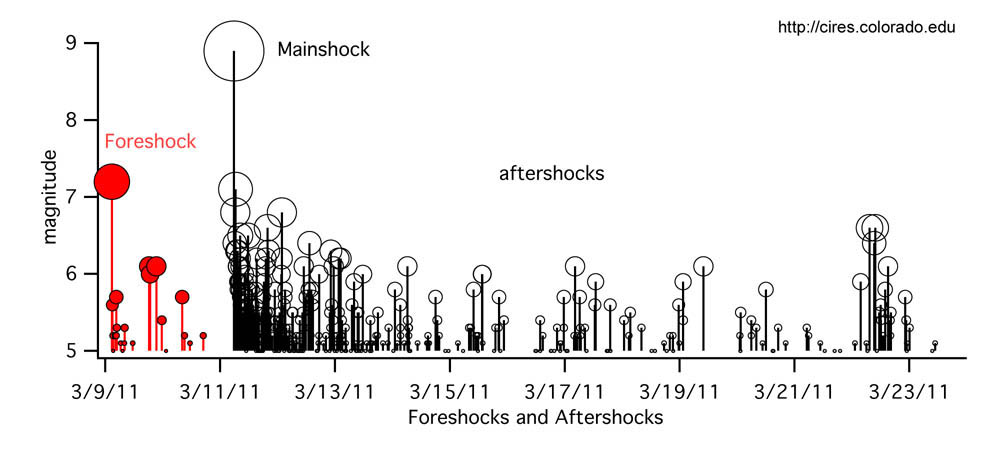 In
the weeks since the main shock, more than a thousand aftershocks were
recorded in the area, about half of
which
registered magnitude 5 or greater. Aftershocks from the quake
continued for many more months. Impacts will
be
felt for many years in the Tohoku region due to the damages caused by
the earthquake shaking and tsunami.
As
the Pacific Plate maintains its process of subduction back
into the Earth’s mantle, repeated adjustments of stress
levels
in the region will occur along the involved tectonic plate boundaries,
and more earthquakes are to be expected
in
this area. As usual, the exact location and timing of future
quakes cannot be specified, and large earthquakes
will
continue to occur in this region, just as we have seen in past years.
_____________________________________
References
Cooperative
institute for Research in Environmental Sciences at the University of
Colorado at Boulder
http://cires.colorado.edu/~bilham/Honshu2011/Honshu2011.html
United
State Geological Survey (USGS)
http://earthquake.usgs.gov/earthquakes/eqinthenews/2011/usc0001xgp/
Incorporated
Research Institutions for Seismology (IRIS)
http://www.iris.edu/dms/nodes/dmc/specialevents/2011/03/11/tohoku-japan-earthquake/
Southern
California Earthquake Center (SCEC)
http://scec.usc.edu/eqresponse/node/315

Earthquakes
in Alabama?
Northern
and North-Central Alabama Seismicity
Earthquakes are actually
fairly common in the eastern half of the United States,
with many of these seen in the New Madrid Seismic Zone (NMSZ) which is
situated
along the Mississippi River, roughly centered at New Madrid, Missouri.
We might see light to moderate shaking in northern Alabama if a strong
earthquake struck in the NMSZ.
The NMSZ is known for a series of three strong earthquakes (with
estimated magnitude between 7 and 8) that struck in 1811-1812.
The Unites States Geological Survey (USGS) estimates the chance of
having an earthquake in the NMSZ with a magnitude 6
or larger in the next 50 years is 25 to 40 percent, and the chance of
seeing an
event similar to one of the 1811–1812
sequence occurring in the next 50 years is about 7 to 10 percent.
In
terms of tectonic plate interactions, the NMSZ is known as an
intraplate zone, located far away from a tectonic plate boundary.
Earthquakes occur here in the large network of faults, buried beneath
hundreds to thousands of feet of mud, sand, and rock,
which formed about 500 million years ago when the region was stretched
in the northwest-southeast direction.
Additional faults have formed much more recently as crustal
rifting/thinning, sediment loading, and downwarp processes
have continued in the NMSZ. Now the region is slowly
undergoing east- west shortening, and the reactivation of old,
subterranean faults within this rift system is thought to be
responsible for the continuing seismicity of the zone,
with most earthquakes occurring at depths of 4-12 kilometers.
But closer to home, we in Alabama could also be affected by another seismically
active area in our region,
the Southern Appalachian Seismic Zone (SASZ), which roughly follows the
Appalachian Mountains
from southwestern Virginia into the northeastern corner and central
part of Alabama (see Figure 1). The USGS says that,
“the Southern Appalachian Seismic Zone is one of the most active
earthquake zones in the eastern United States.”
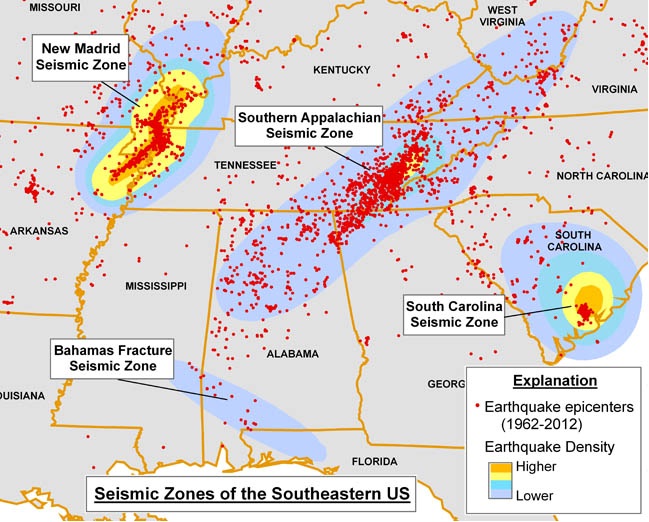
Figure 1
Seismic Zones of the Southeastern United States
Image courtesy of the Geological Survey of Alabama
http://gsa.state.al.us/gsa/geologichazards/Quakes_AL.htm
The SASZ is also an intraplate seismic zone similar to the
NMSZ. The SASZ has released moderate levels
of seismic energy for many hundreds of years. The tectonic
setting for SASZ is crustal uplift/compression,
as opposed to the rifting/downwarp processes seen in the
NMSZ. No active seismic faults are known
to reach the surface in the SASZ, although the area is laced with many
ancient faults that developed
as the Appalachian Mountains formed several hundred million years
ago. While many surface and buried faults
have been located in the region, numerous unknown smaller and more
deeply buried faults remain undetected,
and these all have an ongoing potential for randomly located
small-to-moderate earthquakes.
Some Alabama
Earthquake History
As part of the SASZ, the geology of north and north-central Alabama
includes numerous buried and surface faults,
and the state has seen many small earthquakes, and some 20 larger
events, since shortly before the beginning
of the 20th century (see Figure 2). The recorded history shows that the
earthquakes have been small-moderate,
never reaching above a magnitude of 5.1. This size of earthquake tends
to cause local damage only near the quake epicenter,
with shaking felt in areas further away. Major Alabama events
include a quake seen in 1916 in the Birmingham area,
and one that occurred near Fort Payne in 2003.
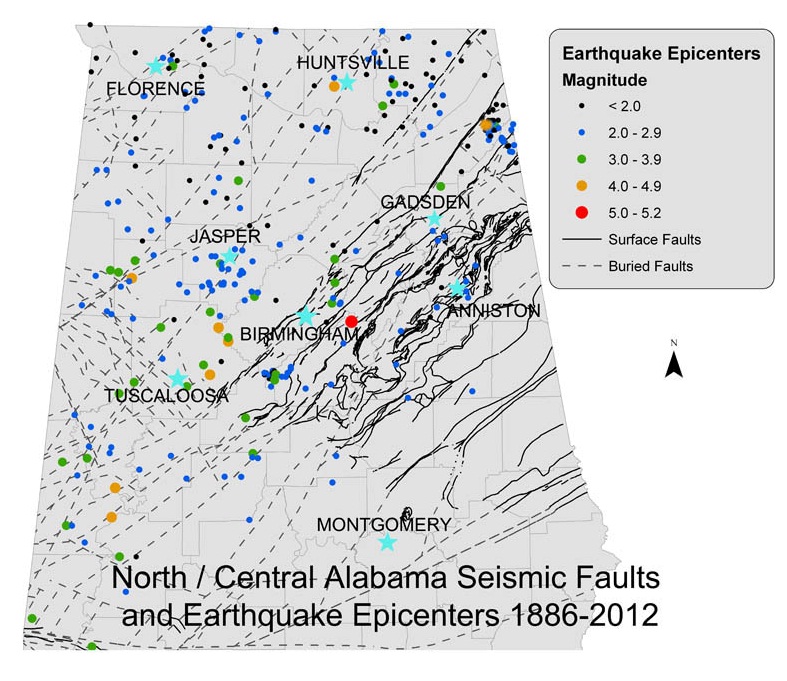
Figure 2
North and North/Central Alabama Seismic Faults and Earthquake Epicenters
Image courtesy of the Geological Survey of Alabama
http://gsa.state.al.us/gsa/geologichazards/Quakes_AL.htm
Alabama’s Largest Earthquake
The largest earthquake in Alabama’s recorded seismic history struck on
October 18, 1916,
on an unnamed fault located east of Birmingham. The strongest
effects were felt at Easonville, in the Irondale area.
Near the epicenter, chimneys were knocked down by the strong quake,
windows were broken, and frame buildings
were "badly shaken." Shaking by the earthquake was felt by
residents in a seven-state area
covering some 100,000 square miles.
North Alabama
Earthquakes
On April 29, 2003, an earthquake with magnitude of 4.9 (some reports
say 4.6) struck in DeKalb County,
a few miles northeast of Fort Payne. The focal depth of the
quake was determined to be approximately 15 km (9.3 miles).
It caused some minor landslides in the area, and caused a shutdown of
the underground water supply for the town
of Valley Head. Shaking from the earthquake caused some minor
building damage in Fort Payne, including broken windows,
minor
cracks in masonry, and broken or collapsed chimneys. The
quake
effects were felt across several southeastern states.
An earthquake with an estimated 3.8 - 4.0 magnitude occurred just north
of Huntsville on August 12, 1959.
Felt over a small area of southern Tennessee and northern Alabama, it
shook bricks from chimneys at Hazel Green,
and damaged another chimney and a newly constructed concrete block
building at Meridianville. Buildings were shaken
violently at New Sharon, with canned goods being knocked from shelves
and frightened residents fleeing from their homes to
the outdoors. The shaking cracked plaster walls and knocked
grocery goods from store shelves in Huntsville.
In more recent years, the historical record shows that several small
quakes have been seen in the Huntsville area.
These include a pair of events, measured at M2.2 and M2.5, in 2011; a
magnitude 3.9 quake that occurred
a few miles east of Huntsville in 2001; and a M3.0 quake seen east of
Huntsville in 1984.
In April 1957, a small earthquake occurred east of
Guntersville. Though it was felt from northern Alabama to
Georgia
and Tennessee, and resulted in some cracking of walls and movement of
some small objects from shelves and tables,
it caused little substantial property damage. According to
local reports, there was “minor damage to several chimneys;
one report of cement steps cracked in two; and several small cracks in
walls. Table-top items tumbled to the floor."
In early March 2013, two magnitude 2.7 earthquakes occurred in Walker
County, Alabama, near the city of Jasper,
at similar focal depths in the range of 4-5 km (2-3 mi). The
seismogram of one of these quakes, the M2.7 event registered
on March 1st, is shown as recorded at the AlabamaQuake seismic station
in Huntsville, Alabama,
at an epicentral distance of some 126 km (see Figure 3).
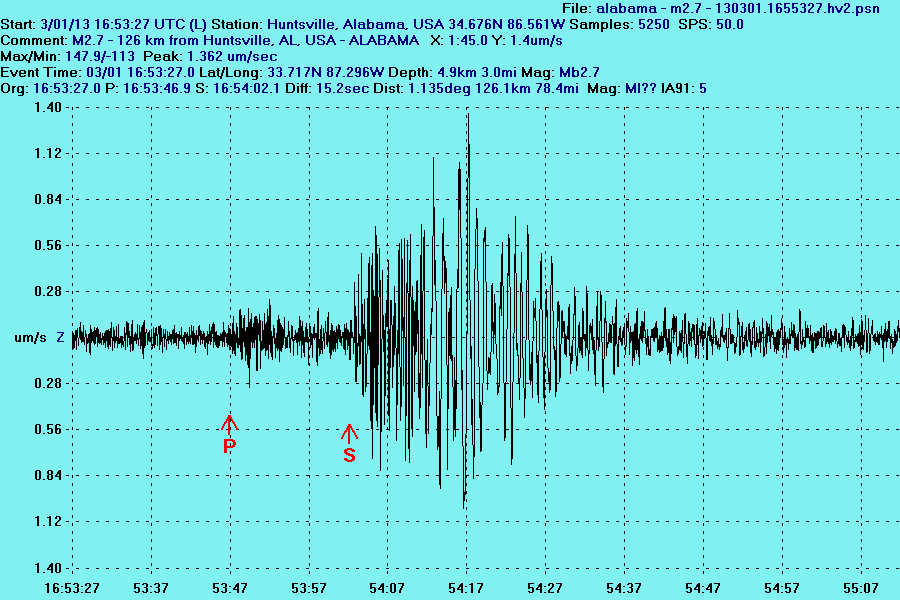
Figure 3
AlabamaQuake Seismogram
M2.7 Earthquake, Walker County, Alabama, March 01, 2013
In Figure 4
below, the three most recent Walker County quake epicenters
have been superimposed onto a
close-up portion of the larger North and North-Central Alabama Faults
and Epicenters map seen above in
Figure 2.
It does not appear that any particular significance can be immediately
attributed to the occurrence
of these two events, even in such close location and time
proximity, given the rich history
of such small
quakes in this area. Note the appearance of these three most
recent quakes near identified
buried faults
traversing the area, and the proximity of these new quakes to
numerous other events seen in
the area.
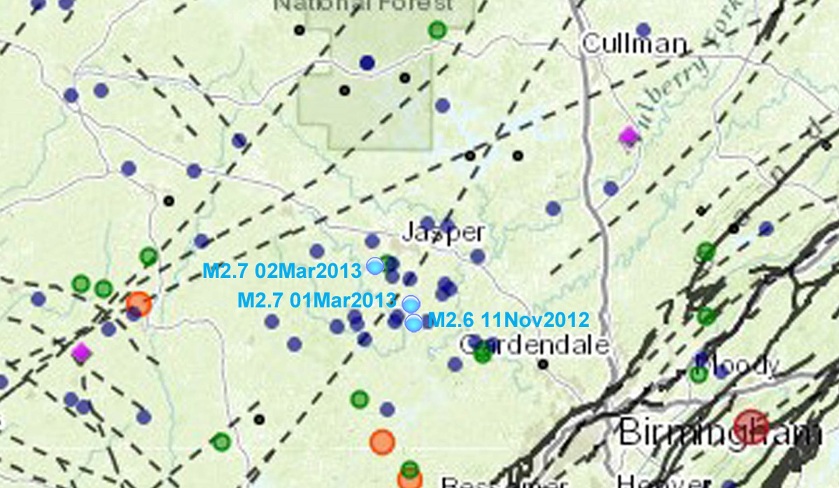
Figure 4
Location of Three Most Recent Walker County, Alabama Earthquakes
Base map image courtesy of the Geological Survey of Alabama
http://gsa.state.al.us/gsa/geologichazards/Quakes_AL.htm
Conclusion
The northern and north-central Alabama region is not considered to be
in a high-risk area for significant
damages caused by earthquakes. However, our proximity to the
New Madrid Seismic Zone calls for a need to
be aware of the potential for local impacts due to a strong earthquake
occurring in that regionally-nearby area.
And the Southern Appalachian Seismic Zone which extends across much of
our area is primarily responsible for
the low-level seismicity and periodic small earthquakes, with
occasional minor damages, seen in this part of the state.

